Explore an interactive view of your Acquisition channels.
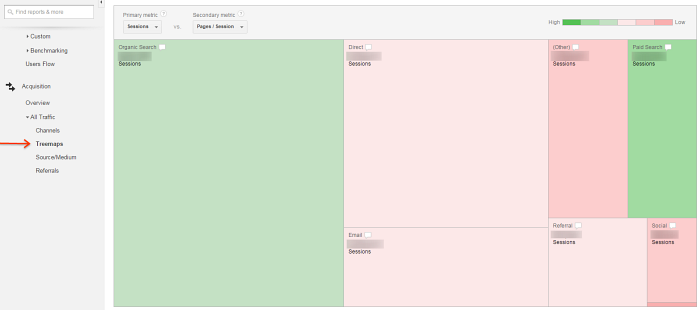
The Treemaps report lets you visually explore trends in your Acquisition channels so you can quickly and intuitively develop hypotheses about your incoming traffic. Treemaps represent data as rectangles. The size and color of each rectangle represent different metrics, so you can combine different aspects of your data into a single visualization. Treemaps are a good hypothesis-generation tool because they can help expose the relative importance of, and the relationship between, different entities.
Use the Treemaps report
Access the report
Type "Treemaps" in the search box above the report navigation, and select the result. You can also browse the report navigation to find it: Acquisition > All Traffic > Treemaps.
Select what data appears in the report
Each rectangle in the report represents a single acquisition channel. Click a rectangle to see a more granular view of each channel displayed in the report. For example, click the Social rectangle and drill down to look at the individual Social Networks where your traffic originated.
Hover over the dialog box icon in each rectangle to get specific data for each metric represented by that rectangle.
After you've clicked a rectangle, a breadcrumb appears above the report to show you where you are in the acquisition channel hierarchy. You can use these links to quickly navigate through the hierarchy. For example, if you've drilled down into the Source level in the report, you can click Referral in the breadcrumb to see that data, instead.
Read the report
All metrics in this report are organized into either a Primary or Secondary group. Use the drop-down menus above the report to select different Primary and Secondary metrics. You can only select one Primary and one Secondary metric at a time.
Primary metrics are volume metrics, like Sessions or New Users, and are represented by rectangle size.
Secondary metrics are relative metrics, like Bounce Rate or Pages/Session, and are represented by color and saturation. Green is positive, and red is negative. The darker the green, the better the Secondary metric, and the darker the red, the worse the Secondary metric.
Example
If you:
- Are looking at Landing Page within the Email channel
- Have selected the Primary metric Sessions and the Secondary metric Pages/Sessions
You’ll see that:
- The larger the rectangle, the higher the number of sessions for that landing page.
- Landing pages that have fewer pages/session will be on the red color scale, and the darker the red, the lower the number of pages/session.
- Landing pages with more pages/session will be green, and the darker the green, the greater the number of pages/session for that landing page.
Based on these data points, you can start to form hypotheses: which landing pages you should use because they have more pages/session, or which landing pages should you focus on because they drive the most sessions (in absolute terms).
Limits and caveats
The Treemaps report is only available in web reporting views. This report is not available in other types of reporting views, like mobile app views. Learn more about views.
The treemap will only display up to 16 rectangles at a time. If you have more than 15 entities to display in the treemap, the first 15 appear as individual rectangles, and the rest are grouped together. In the report, the grouped category appears as one rectangle labeled Other.
Segmentation is not (yet) supported in the Treemaps report.
Higher numbers are better for all metrics, except for the Secondary metric Bounce Rate. For the Secondary metricBounce Rate, higher numbers are worse. This report automatically considers this and reverses the green-to-red overlay color scale for this metric; the higher your Bounce Rate, the darker the red color. Similarly, the lower your Bounce Rate, the darker the green color.
The color scale is relative to the weighted average of all entities. The color spectrum moves from red to green, and the intensity of the color that appears in each rectangle is relative within your report. There are no absolute or fixed values associated with any specific color or shade of color.


