Showing posts with label Google Analytics. Show all posts

Saturday, June 6, 2015

SEO 101 en 2015

Un article pertinent publié cette semaine par:

Conseiller externe en marketing et communications numériques | Directeur des communications au Web à Québec

Les 8 piliers du référencement naturel en 2015

La bonne vieille époque du backlinking massif est révolue... et c'est tant mieux! Dorénavant, référencement naturel rime avec contenu de qualité. Toutefois, avant de vous lancer dans la création d'une stratégie de contenus, plusieurs éléments sont à optimiser. Voici ceux qui vous permettront de maximiser considérablement et rapidement l'impact de votre référencement naturel pour ainsi atteindre les objectifs mentionnés dans votre stratégie Web.

Une histoire de mots-clés

Peu importe l'orientation de votre stratégie SEO, les listes de mots-clés ont un impact considérable sur celle-ci. Après avoir défini les expressions pertinentes à vos objectifs, pensez à quantifier le volume de recherche que ces dernières génèrent. Si ces volumes sont satisfaisants, mesurez la concurrence qui existe pour les termes sélectionnés. Pour cela, assurez-vous que votre Google Webmaster Tools soit connecté à votre Google Analytics et tirez le plein potentiel du Google Keywords Planner!

Repensez votre stratégie de liens entrants

Penguin est une mise à jour de l'algorithme de Google qui a profondément boulversé le SEO et notamment les stratégies de création de liens. Pour satisfaire aux exigences de celui-ci, il est important de préférer la qualité à la quantité quant aux liens entrants sur votre plateforme. Bien qu'il soit essentiel de bénéficier du jus provenant de sites Web ayant une forte crédibilité, il est également important d'avoir une certaine hétérogénéité quant à la provenance de vos liens et de leurs ancres. Enfin, veillez également à faire varier la location géographique de vos liens entrants ainsi que la langue de ces derniers.

Renseignez la nature et le contenu de vos pages

Bien que leur impact sur votre référencement naturel soit majeur, les URLs ne sont pas les seuls leviers à activer pour informer les moteurs de recherche sur vos pages. La meta title et la meta description restent, bien entendu, des impératifs auxquels vous devez porter le plus grand soin. Pour cela, mettez en place une structure quant à la rédaction de ces metas éléments. Enfin, n'oubliez pas que les différents attributs (robots, lang...) et les balises titres (h1, h2, h3...) peuvent également apporter le coup de pouce qui fait toute la différence en matière de référencement naturel.

Optimisez votre code au niveau élite

La qualité du code de votre site Web est un facteur déterminant quant à l'optimisation de votre référencement naturel. Commencez par inspecter le nombre de ressources CSS et Javascript qui sont appelées et, surtout, où ces ressources se situent. Une fois identifiées, veillez à ce que celles-ci soient compressées afin de faciliter le chargement de la page où elles se situent. Enfin, dans l'éventualité où vous travailleriez avec WordPress, assurez-vous que le nombre de plugin utilisé soit le moins important possible.

Minimiser le temps de chargement de vos pages

Plusieurs des éléments mentionnés ci-dessus sont de précieux atouts pour l'optimisation du chargement de votre site Web. Toutefois, il existe bien d'autres astuces! L'optimisation de vos médias, images en tête de liste, est sans conteste l'une d'entre elles. Après avoir redimensionné et compressé celles-ci, veillez impérativement à ce qu'un système de mise en cache soit actif. Enfin, assurez-vous que votre serveur soit à jour et que les éléments hébergés sur celui-ci soient compressés afin de tirer le meilleur de votre hébergement.

Go mobile or die!

Depuis le 21 avril 2015, Google pénalise le référencement des sites Web dont le contenu et le contenant ne sont pas adaptatifs aux résolutions d'écrans. Pour relever avec brio ce nouveau défi, veillez tout d'abord à ce que l'architecture de vos pages s'adapte en fonction des résolutions d'écran les plus populaires. Ensuite, assurez-vous que les liens et boutons soient suffisamment espacés afin d'en faciliter l'utilisation. Enfin, faites en sorte que les polices et les couleurs de textes soient facilement lisibles, et cela peu importe le contexte de lecture.

Renforcez votre référencement local

Bien qu'avoir une fiche Google My Business soit une bonne chose, cela n'est pas suffisant pour tirer pleinement profit du référencement local. Tout d'abord, uniformisez et mentionnez votre adresse sur les pages de votre site Web où cela apporterait une valeur ajoutée. Pensez également à enrichir vos metas données et vos balises titres avec la province, la ville ou encore le quartier où se situe votre organisation. Autre bonne pratique, renseignez totalement et uniformément votre profil sur les différents réseaux sociaux où vous êtes présent.

Transformez votre muffin en cupcake

Si vous pensez que les killer features sont inutiles, le référencement naturel n'est clairement pas pour vous! En SEO, c'est justement ces petits plus qui font toute la différence. Par exemple, l'utilisation d'extraits enrichis permet à vos pages Web d'accroitre leur visibilité dans les résultats des moteurs de recherche, augmentant ainsi le traffic vers celles-ci. On parle ici du futur du référencement, ni plus, ni moins. Autres fonctionnalités, les cartes Twitter ainsi que les metas Open Graph qui augmentent considérablement le taux de clic sur vos publications, et par conséquent votre traffic.
En fonction de la nature de votre site Web, plusieurs fonctionnalités supplémentaires peuvent être optimisées. La gestion multilingue, l'implantation de votre certificat SSL ou encore l'optimisation de vos vidéos externes en sont de parfait exemples. Une fois ces éléments ajustés, réfléchissez à votre stratégie de création de contenu. Grâce à elle, vos consommateurs potentiels auront de grandes chances de vous retrouver dans les moteurs de recherche tout au long de leur processus d'achat.

Sunday, April 26, 2015

Data Import - Geographical Data

Organize your data around your company's geographic regions.

Importing geographical data enables the mapping of geographical IDs to custom regions, allowing you to report on and analyze your Google Analytics data in ways that are better aligned with your business organization.

    How Geographical Data import works

    Google Analytics provides a number of geographical dimensions, such as City, Country, Continent, etc. The values for these dimensions are automatically derived from the IP address of the hit, which is convenient but also has a few drawbacks:
    • IP-based locations are approximate.
    • Values for standard geographic dimensions are localized into the user's preferred language, possibly making it complicated to share the data with users who speak other languages or use other tools.
    • Many businesses operate in arbitrary regions that make sense to them but that don't appear on a map. For example in North America, you might operate in East, Central, and West groups of states or provinces. In Europe, companies might operate across North, Central, and South groups of countries.
    As an alternative to IP-based regions, you can create your own custom regions by mapping them to a set of geographical ID dimensions. These dimensions are based on widely used standards, so sharing the data with other users and applications is simpler. The table below lists the available geographical IDs and the standards upon which they are based.
    Geographical ID dimensions and standards
    Dimension NameID Standard
    City IDGeographical Criteria ID
    Country ISO CodeISO-3166-1 alpha-2
    Region IDGeographical Criteria ID
    Sub Continent CodeUN M.49

    Data Set details

    The Data Set is the container that will hold your imported data. Expand the section below to see the Data Set details.


    pssst.....Original Article

    Saturday, April 25, 2015

    Advertising reports - Remarketing with Google Analytics

    Use your Remarketing Audiences in AdWords

      If you close a remarketing list in AdWords, that list no longer accumulates users, but it still serves ads.

      Add your audience to an ad group

      When you create a Remarketing Audience in Analytics, it is then available in the advertising account you selected. If you selected an AdWords account, then you need to add that audience to at least one of your ad groups before the users in that audience are eligible to see your ads. (Remember, your ad still needs to win the auction before anyone sees it.)

      Create custom-combination lists

      In AdWords you can use custom-combination lists to build sets of conditions from existing remarketing lists (including the Remarketing Audiences you created in Analytics), interest categories, and existing combinations of lists, and then display your remarketing ads to users who meet those conditions.
      For example, if you wanted to remarket to people who had visited the product pages for your new hybrid car and whose web travels had also demonstrated an interest in hybrid vehicles, you could:
      • Create a list in Analytics based on a Segment that identified users who viewed your hybrid-car pages.

      • In AdWords, combine that list with users who fall into the interest category of Hybrid & Alternative Vehicles.

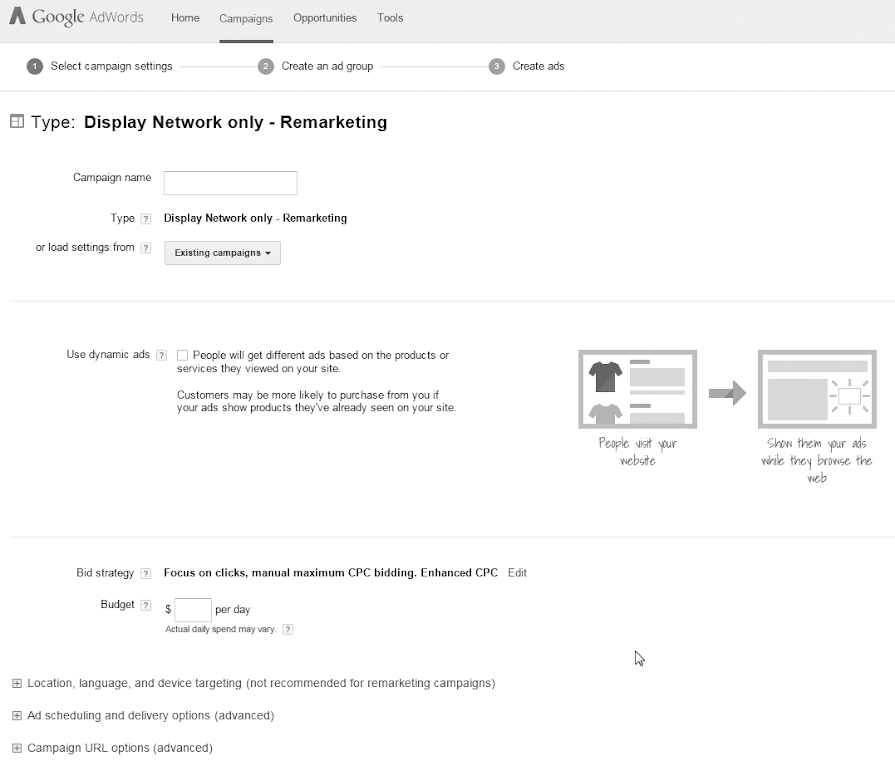
      Link directly from Analytics to AdWords to create a campaign

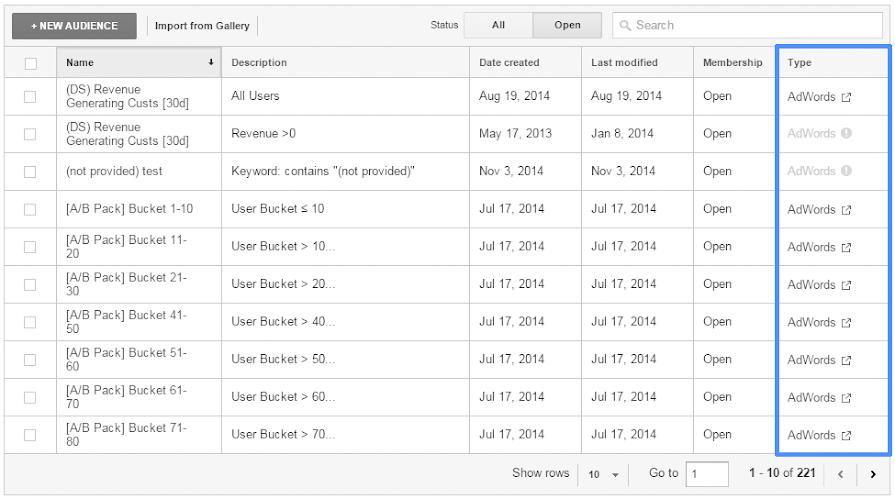
      The list of Remarketing Audiences contains a link for each audience to its respective AdWords account.

      If your current Analytics login has access to the linked AdWords account, then the link in the table is active for you.
      Click the link to start creating your AdWords campaign based on the Remarketing Audience:


      Related resources

      Friday, April 24, 2015

      Google Analytics - Treemaps report

      Explore an interactive view of your Acquisition channels.

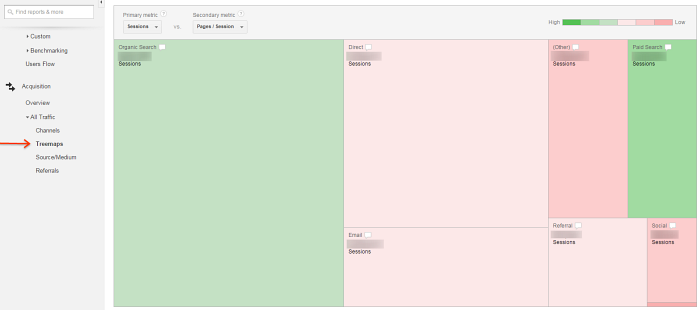
      The Treemaps report lets you visually explore trends in your Acquisition channels so you can quickly and intuitively develop hypotheses about your incoming traffic. Treemaps represent data as rectangles. The size and color of each rectangle represent different metrics, so you can combine different aspects of your data into a single visualization. Treemaps are a good hypothesis-generation tool because they can help expose the relative importance of, and the relationship between, different entities.

      Use the Treemaps report

      Access the report

      Type "Treemaps" in the search box above the report navigation, and select the result. You can also browse the report navigation to find it: Acquisition > All Traffic > Treemaps.

      Select what data appears in the report

      Each rectangle in the report represents a single acquisition channel. Click a rectangle to see a more granular view of each channel displayed in the report. For example, click the Social rectangle and drill down to look at the individual Social Networks where your traffic originated.
      Hover over the dialog box icon in each rectangle to get specific data for each metric represented by that rectangle.
      After you've clicked a rectangle, a breadcrumb appears above the report to show you where you are in the acquisition channel hierarchy. You can use these links to quickly navigate through the hierarchy. For example, if you've drilled down into the Source level in the report, you can click Referral in the breadcrumb to see that data, instead.

      Read the report

      All metrics in this report are organized into either a Primary or Secondary group. Use the drop-down menus above the report to select different Primary and Secondary metrics. You can only select one Primary and one Secondary metric at a time.
      Primary metrics are volume metrics, like Sessions or New Users, and are represented by rectangle size.
      Secondary metrics are relative metrics, like Bounce Rate or Pages/Session, and are represented by color and saturation. Green is positive, and red is negative. The darker the green, the better the Secondary metric, and the darker the red, the worse the Secondary metric.

      Example

      If you:
      • Are looking at Landing Page within the Email channel
      • Have selected the Primary metric Sessions and the Secondary metric Pages/Sessions
      You’ll see that:
      • The larger the rectangle, the higher the number of sessions for that landing page.
      • Landing pages that have fewer pages/session will be on the red color scale, and the darker the red, the lower the number of pages/session.
      • Landing pages with more pages/session will be green, and the darker the green, the greater the number of pages/session for that landing page.
      Based on these data points, you can start to form hypotheses: which landing pages you should use because they have more pages/session, or which landing pages should you focus on because they drive the most sessions (in absolute terms).

      Limits and caveats

      The Treemaps report is only available in web reporting views. This report is not available in other types of reporting views, like mobile app views. Learn more about views.
      The treemap will only display up to 16 rectangles at a time. If you have more than 15 entities to display in the treemap, the first 15 appear as individual rectangles, and the rest are grouped together. In the report, the grouped category appears as one rectangle labeled Other.
      Segmentation is not (yet) supported in the Treemaps report.
      Higher numbers are better for all metrics, except for the Secondary metric Bounce Rate. For the Secondary metricBounce Rate, higher numbers are worse. This report automatically considers this and reverses the green-to-red overlay color scale for this metric; the higher your Bounce Rate, the darker the red color. Similarly, the lower your Bounce Rate, the darker the green color.
      The color scale is relative to the weighted average of all entities. The color spectrum moves from red to green, and the intensity of the color that appears in each rectangle is relative within your report. There are no absolute or fixed values associated with any specific color or shade of color.

      Related resources

      Tuesday, April 21, 2015

      About Google Tag Manager - Before You Begin

      To ensure that Google Tag Manager is configured to meet your business needs, consider the following points.
      How many accounts are needed? Who should create them?
      Set up one account per company. The company for which the tags will be managed should create the account in Google Tag Manager. For example, if an agency manages tags on behalf of an advertiser, the advertiser should create the Google Tag Manager account and then add the agency's Google account as a user. Read Setup and Workflow to learn how to set up an account.
      Agencies can manage their clients' Google Tag Manager accounts by signing into their own Google Account (assuming that the clients have followed the best practice of (1) creating the Google Tag Manager account themselves and (2) adding the agency's Google account as a user). Also, multiple users can manage the same Google Tag Manager account, and each user can be given different access permissions by the account administrators. Read Users and Permissions to learn more.
      Are you a mobile app developer?
      Set up one container per mobile app. Each new major version of your app should have a new container. (Minor updates to an app can use the same container since the config keys will likely be the same or very similar.)
      Do you manage multiple domains? (Web)
      Typically, you set up one container per web domain. However, if the user experience and tags on a website span more than one domain, it's best to set up a single container that serves all the domains involved. Here are a few considerations:
      • Configuration (rules, triggers, and variables) can't be shared across containers. So, if the tags and firing logic is similar across domains, it makes sense to use a single container, because maintaining multiple similar configurations is time-consuming and error-prone.
      • Having many tags in a single container can be confusing, and managing the container becomes more difficult. Also, defining too many tags and triggers increases the size of the container and the amount of data that the browser must download.
      • User permissions can only be set at the container level. If you need to prevent the administrators of different domains from changing each other's configurations, use a different container for each domain.
      • When someone publishes a container, all changes go live, regardless of domain. If you need to apply changes to one domain without affecting other domains, use a different container for each domain.
      Read Setup and Workflow (Web) to learn about accounts and containers.
      What tags do you have deployed on your website? Where?
      Begin by identifying all of the tags you have deployed on your site and where they are deployed (e.g. in global headers or footers, on landing pages, confirmation pages, in response to button clicks, etc.)
      Think about what information you want to collect and determine if there are additional tags you want to deploy. If the data you want to collect is not visible on the page, refer to the developer documentation for information on how to pass additional data to tags.
      If all of your tags fire as pages are loading, and these pages can be identified by their URLs, a basic container implementation may be sufficient for your needs. Once your Google Tag Manager account and container have been created, simply place the provided container snippet (generated when you create the container) on every page of your website immediately after the opening HTML body tag. Read Setup and Workflow (Web) to learn about containers and the container snippet.
      If any of your tags fire on button clicks, events, or specific pages that are indistinguishable by URL, your webmaster may need to customize your container implementation. Refer to the Google Tag Manager developer documentation for more information.
      Regardless of whether you need a basic or customized container implementation, plan for a site-wide deployment in which you migrate all your tracking tags into Google Tag Manager at one time. This allows you to take full advantage of Google Tag Manager's benefits. When you want to add or edit tags in the future, you won’t have to retag your site and you can manage all your tag updates using Google Tag Manager.

      Monday, April 20, 2015

      About Google Tag Manager

      New Version of Google Tag Manager is Available


      Google Tag Manager allows you to quickly and easily update:
      • Tags and code snippets on your website, such as those intended for traffic analysis and marketing optimization. You can add and update AdWords, Google Analytics, Floodlight, and 3rd party or custom tags from the Google Tag Manager user interface instead of editing site code. This reduces errors, frees you from having to involve a web developer, and allows you to quickly deploy new features or content onto your site. Read Google Tag Manager for the Web, below.
      • Configuration and flag values of mobile apps that you have created. Instead of rebuilding and deploying new binaries, you can use the Google Tag Manager interface to change configuration values (for example, timeout, ad position, game play dynamics) and turn on flag-enabled features in your mobile apps. Read Google Tag Manager for Mobile Apps, below.

      What is a tag?

      A tag is snippet of JavaScript that sends information to a third party, such as Google. If you don't use a tag management solution such as Google Tag Manager, you need to add these snippets of code directly to files on your website or mobile app. With Google Tag Manager, you no longer need to maintain each of these code snippets in your source files. Instead, you specify the tags that you want to fire, and when you want them to fire, from within the Google Tag Manager user interface.

      How It Works

      Google Tag Manager works via its own container tag that you place on all your website pages. The container tag replaces all other tags on your site, including tags from AdWords, Google Analytics, Floodlight, and 3rd party tags. (See a list of supported tags.) Once the Google Tag Manager container tag has been added to your site, you update, add, and administer additional tags right from the Google Tag Manager web application.
      Your Google Tag Manager account allows you to administer the tags for one or more websites. Although you can set up multiple Google Tag Manager accounts from a single Google account, you’ll typically only need one Google Tag Manager account per company or organization. Read Setup and Workflow to learn more.

      Setup for Web

      To manage tags using Google Tag Manager:
      • Go to tagmanager.google.com to create an account (or to access an existing account).
      • Create a container for your site in the account.
      • Add the container snippet to your site.
      • Migrate any hardcoded tags (such as AdWords or DoubleClick tags) from your site’s source code into Google Tag Manager.
      You’ll then be ready to do all of your future tag management for your site via the Google Tag Manager user interface. For more information, read Setup and Workflow.

      Google Tag Manager for Mobile Apps

      Google Tag Manager is useful for managing configuration values that you want to change in the future, or that can change conditionally. Instead of defining constant values in your mobile app, you can make them dynamic and use Google Tag Manager to manage the rules that govern how these values change. Examples include:
      • dimensions and locations of ads served in your application, for example, to change ad banner height based on screen size
      • game settings
      • user interface settings, such as differences between platforms
      • localized strings determined by device language

      How It Works (Mobile Apps)

      A container in Google Tag Manager holds the variables and triggers (formerly known as rules and macros) which govern how the configuration and flag values in your app are set. You manage the container – editing its variables and triggers, previewing, testing, and publishing new versions of the container – from your Google Tag Manager account. During app development, you use the Google Tag Manager SDK to associate a container with the app. You also provide a default container to deploy with the app. The default container is used to set default configuration values until the first time a container is downloaded. Once the app has connected to the internet and downloaded a container, it will never use the default container again. Applications periodically check for container updates, typically every 12 hours.

      Setup for Mobile Apps

      • Go to tagmanager.google.com to create a Google Tag Manager account (or to access an existing account).
      • Create a container for your app in the account (select the "Mobile Apps" option).
      • Download and implement the Google Tag Manager for Mobile SDK.
      Read Setup and Workflow (Mobile Apps) for details.

      Next Steps

      Tuesday, March 31, 2015

      Best Practices For Table Filters In Google Analytics

      Submitted by Paul Koks on March 2015 from  Online Behavior 


      Advanced Table Filters on Google Analytics
      Table filters are a very powerful feature in Google Analytics. They allow you to perform deep analysis from within the interface. From experience, I can say that many Google Analytics users don't know how to effectively use this feature, a missed opportunity for sure!
      Most reports in Google Analytics contain one dimension and several metrics by default. However, it is easy to add a secondary dimension to your report, as seen in the screenshot below. And table filters really help you to slice and dice through your reports and their building stones - metrics and dimensions - in a more efficient way.
      Table Secondary Dimensions
      In this article I will guide you through table filters and a few related topics.

      View Filters vs. Table Filters

      I would like you to understand the basic concepts first, this will make it easier to get the complete picture.
      View filters are applied before the Google Analytics data is saved in your account. They are set up in the Admin interface and will apply to all data in the view, forever. I won't go into much detail and examples about view filters here. Read this guide to Google Analytics filters for in-depth information on view filters.
      Table filters work in a different way, they are ad-hoc segmentation filters. Contrary to view filters, these filters don't permanently affect any data from your reporting view. You can think of it as filters in Excel. There are two types of table filters:
      • Standard table filters allow you to filter data for the first dimension in your report and this can sometimes be limiting.
      • Advanced table filters are more powerful as they allow you to filter on all available dimensions and metrics in your report.
      By now you understand the difference between the different filter types that are available in Google Analytics, here is a quick overview.
      Filter Comparison Table
      A good knowledge of regular expressions is very handy when working with both filter types. I recommend learning at least the basics.

      Filtering Standard Reports with Advanced Table Filters

      Below I discuss how to create advanced table filters on Google Analytics.
      1. Click on the advanced link to the left of the search field
      Advanced Filter link
      2. Choose your filter
      Advanced Filter Levels
      • First level: include or exclude
      • Second level: dimension or metric
      • Third level: matching type
      • Fourth level: filter field
      3. (optional) Filter two dimensions simultaneously
      You have the option to filter on two different dimensions at the same time if you add a secondary dimension to your report, as shown below. Here both Browser and Source / Medium are visible in the Google Analytics report and advanced filter field.
      Filtering Google Analytics using two dimensions
      Note: the advanced table filter is limited to the dimensions and metrics that are included in your report. Also, by default the advanced table filter is linked to an AND equation. By smartly working with regular expressions you can build an OR equation as well. Google Analytics accepts RegEx in both standard as well as advanced table filters.

      Concluding Thoughts

      • Make sure to understand the difference between view filters and table filters
      • Start every data deep dive with a business question; what are you trying to solve?
      • Advanced table filters provide you with a great option to filter out anomalies before exporting or presenting a report
      • Start with one or two advanced filters and expand if you need to
      • Make sure enough data on the level of dimensions remains to draw statistically significantconclusions.